Enrichment, Tables & AI
Once differential expression has run, the Enrichment and Tables tabs turn your gene lists into biology and let you browse and export every result. DEBrowser also ships an optional AI interpretation assistant that summarizes the biology of a gene set.
GO / KEGG over-representation
The Enrichment tab (top-level tab 5) runs over-representation analysis
with clusterProfiler.
Pick the gene list to analyze — all detected, a Main-Plot / heatmap selection,
or a comparison’s up/down set — and choose an ontology on the left:
enrichGO — enriched Gene Ontology terms
enrichKEGG — enriched KEGG pathways
Disease — disease-ontology enrichment
compareCluster — compare enrichment across clustered gene sets
Set your organism, padj, and fold-change cutoffs, then click Submit.
Changing the ontology exposes ontology-specific parameters at the bottom of the
option panel. Results render as either a Summary plot or a Dot plot
(switch with the Plot Type selector), and the enriched categories appear on
the Tables tab, where DE Genes lists the genes behind any category.
Note
Selecting the correct organism is required before enrichment will run.
For the bundled Vernia demo this is mouse (org.Mm.eg.db).
GSEA (gene-set enrichment)
Beyond over-representation, DEBrowser runs rank-based GSEA with fgsea against MSigDB collections. Load a gene-set collection, and DEBrowser ranks your genes and reports enriched pathways with a leading-edge view and a normalized-enrichment-score (NES) heatmap across comparisons — useful for seeing which pathways move consistently across several contrasts.
Data Tables
The Tables tab (top-level tab 6) renders results as searchable, sortable
tables. Choose a dataset from the left panel:
All Detected
Up Regulated
Down Regulated
Up+Down Regulated
Selected scatterplot points
Most varied genes
Comparison differences
Every table (except Comparisons) includes: gene ID, per-sample normalized counts, condition averages, padj, log2FoldChange, foldChange, and log10padj. The Comparisons table adds, for each pairwise contrast, the per-sample values plus foldChange, p-value, and padj.
Tip
Every table has a search box (top-right); the left-panel search accepts
comma-separated lists and regex (e.g. ^al, *lm) and applies
everywhere in DEBrowser — plots and tables alike. If you enter more than
three lines of genes, the search matches the beginning and end of each
phrase; otherwise it matches substrings.
To change parameters or add comparisons, return to Data Prep and resubmit.
AI interpretation (optional)
DEBrowser includes an optional AI assistant that summarizes the biology of a gene set alongside a selected GSEA pathway on the Enrichment tab. It is off by default — no network calls happen until you explicitly enable it and configure a provider.
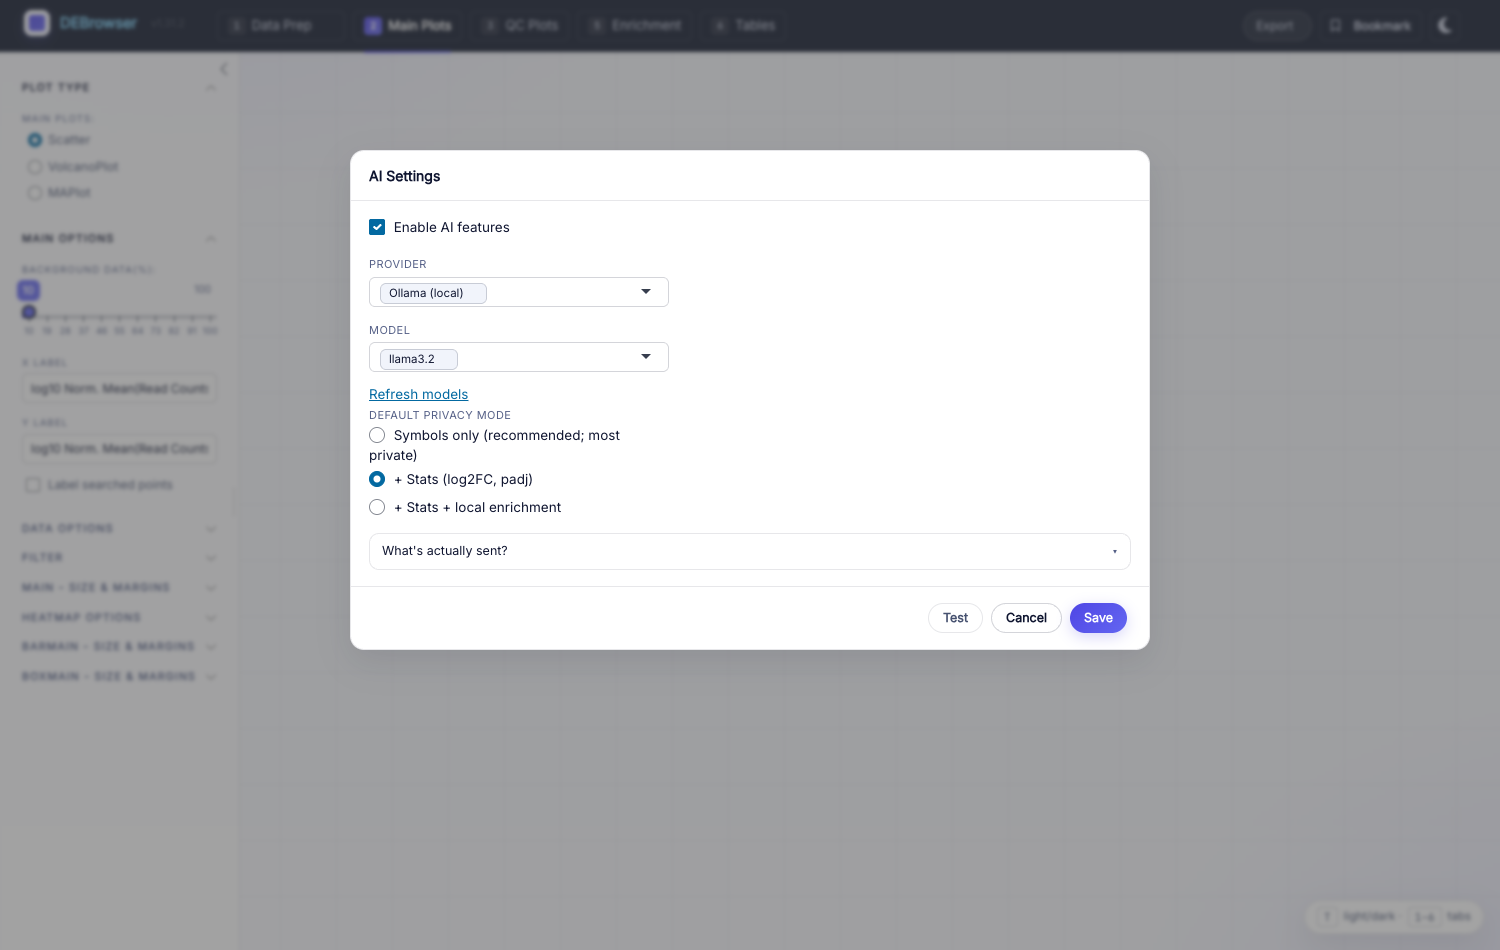
Enabling AI features
Open AI Assistant (the settings entry in the navbar). A dialog opens.
Tick Enable AI features.
Pick a Provider:
Anthropic (Claude) — API key from console.anthropic.com.
OpenAI (GPT) — API key from platform.openai.com.
Ollama (local LLM, no key) — runs entirely on your machine; the privacy-preserving option, since no data leaves your computer.
Choose a Model (auto-populated from your provider; use Refresh models to re-fetch).
For Anthropic / OpenAI, paste your API key — stored encrypted in your OS keychain via
keyring, never in plaintext on disk.Pick a default privacy mode (recommended: Symbols only).
Click Test for a one-token round-trip, then Save.
After saving, an AI interpretation card appears below the Leading edge card on the Enrichment tab whenever a GSEA pathway is selected. Pick a question, adjust privacy and Top-N, preview the exact prompt with What will be sent?, then click Ask AI.
Privacy modes
Three per-call modes control what leaves your machine:
Symbols only (default; most private) — just the leading-edge gene symbols.
+ Stats — also
log2FoldChangeand adjusted p-value per gene.+ Stats + Enrichment — also the term name, fgsea p-value, and overlap count.
Responses render as plain preformatted text — no markdown parsing, no HTML execution, no automatic link traversal — as a defense against untrusted-content patterns in model output.
Installing the AI packages
The AI features depend on three Suggests packages:
install.packages(c("ellmer", "whisker", "keyring"))
If any are missing, AI stays unavailable and DEBrowser shows a clear “Install
the X package…” notice; the rest of the app is unaffected. R CMD check and
BiocCheck both pass without any AI package installed — the feature is
strictly additive.
Installing Ollama (local provider)
Ollama runs the model on your own machine — no API key, no data sent out. On Apple Silicon the standalone install uses the Metal GPU and is far faster than Docker (which runs Ollama in a Linux VM that cannot reach the Apple GPU):
brew install ollama          # or the .dmg from https://ollama.com/download
ollama serve &               # the menu-bar app also starts this
ollama pull llama3.2         # ~2 GB, one-time
On Linux:
curl -fsSL https://ollama.com/install.sh | sh
ollama pull llama3.2
Verify the API (default http://localhost:11434):
curl http://localhost:11434/api/tags
Settings → AI → Provider: Ollama → Test runs this check and surfaces a “Could not reach Ollama” hint if the service is down.
Note
DEBrowser is used in biomedical settings where sharing patient-derived gene names with a third-party LLM may be unacceptable. The master switch keeps the feature inert until you explicitly opt in, and the local Ollama option keeps everything on your machine.