DEBrowser documentation
DEBrowser turns RNA-Seq differential expression analysis into an interactive, point-and-click workflow. It wraps three established Bioconductor engines — DESeq2, edgeR, and limma — in a Shiny app, so changing a cutoff, a normalization method, or a comparison re-draws every plot and table in real time. No code is required to explore your results, and full reproducibility exports are one click away when you are done.
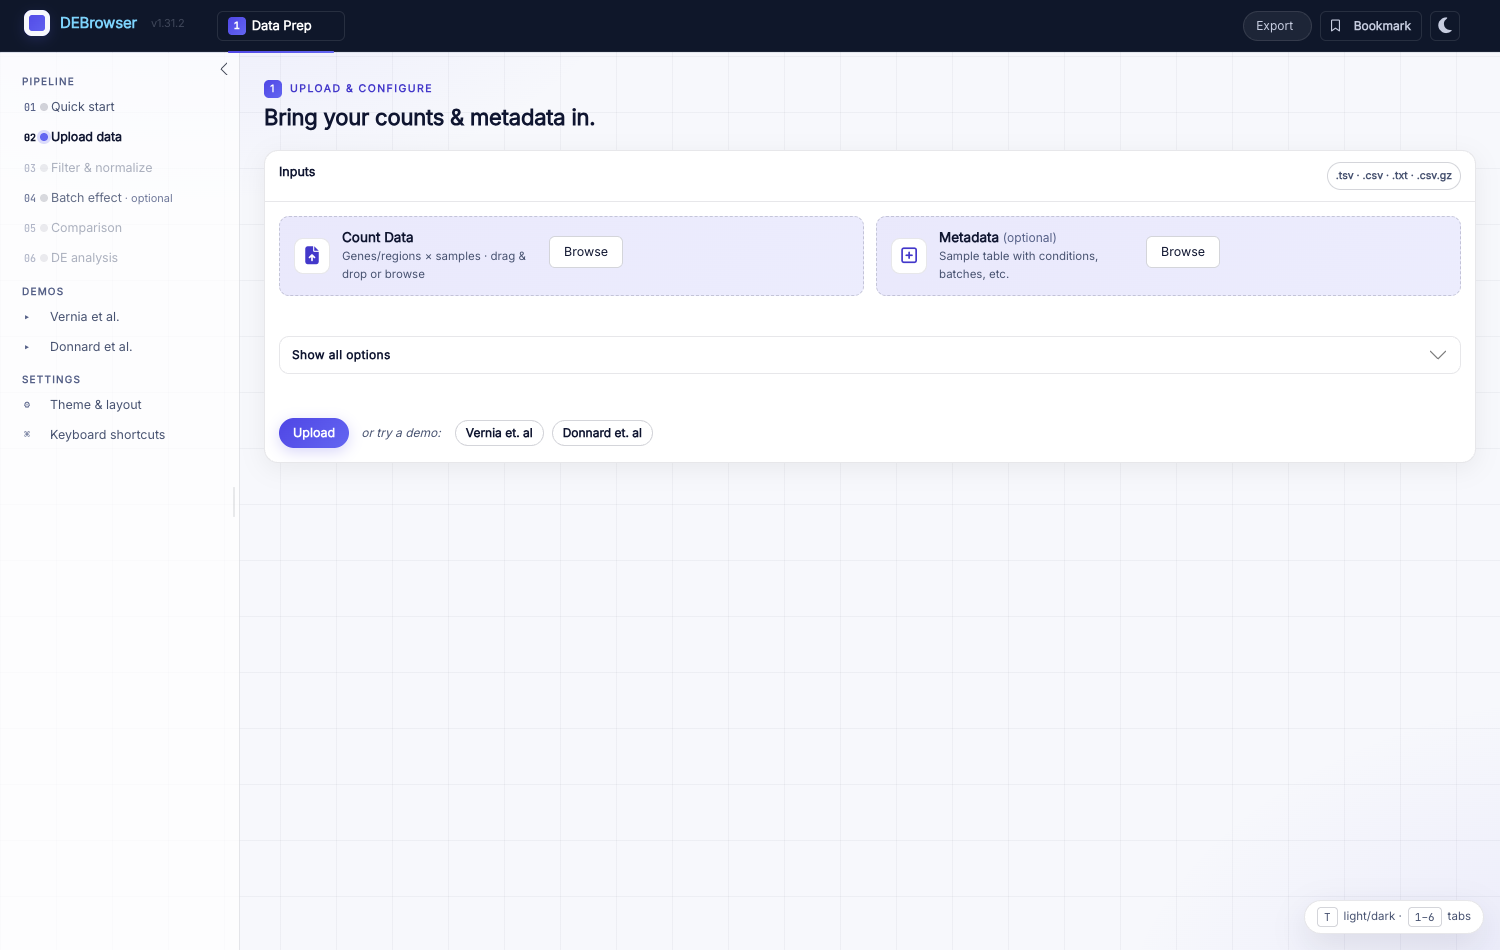
DEBrowser is organized as a guided six-step Data Prep wizard (Quick start → Upload → Filter & normalize → Batch effect → Comparison → DE analysis) followed by five result tabs — Main Plots, QC Plots, Concordance, Enrichment, and Tables. Along the way it offers batch-effect correction, interactive scatter/volcano/MA plots with linked heatmaps, GO/KEGG and GSEA enrichment, cross-contrast concordance, exportable result tables, bookmarking and reproducibility exports, and an optional AI interpretation assistant.
Contents
- Installation Guide
- Quick-start Guide
- Getting Started
- Low Count Filtering
- Batch Effect Correction and Normalization
- Comparison Selection & DE Analysis
- The Main Plots of DE Analysis
- The Heatmap of DE Analysis
- Quality Control Plots
- Concordance
- Enrichment and Data Tables
- Bookmarking & sharing
- Reproducibility & export
- Theming & keyboard shortcuts
- Autoload Data via Hyperlink
- DE Analysis
- Heatmaps
- Enrichment, Tables & AI
- Worked Example
- DEBrowser Modules
- Frequently Asked Questions (FAQ)
- Why un-normalized counts?
- Why am I getting an error while uploading files?
- Why did some columns not show up after upload?
- Why can’t I see all the background data in Main Plots?
- Why do I get an error when I click DE Genes in the Enrichment tab?
- How do I download selected data from Main Plots / QC Plots / Heatmaps?
- How do I switch between light and dark mode?
- Can I save or share an analysis?
- Is the AI assistant safe to use with sensitive data?
- DEBrowser Additions
Getting started
if (!requireNamespace("BiocManager", quietly = TRUE))
    install.packages("BiocManager")
BiocManager::install("debrowser")

library(debrowser)
startDEBrowser()
See the Installation Guide for source builds and system dependencies, then the Quick-start Guide for a full walkthrough.
Citation
If you use DEBrowser in your research, please cite:
Kucukural A, Yukselen O, Ozata DM, Moore MJ, Garber M. DEBrowser: interactive differential expression analysis and visualization tool for count data. BMC Genomics 2019, 20:6. doi: 10.1186/s12864-018-5362-x